Introduction
Per my May article, Shopify (NYSE:SHOP) is in the early stages of big AI improvements. Since that time, the 2Q24 release has come out and the numbers were impressive.
My thesis is that Shopify continues increasing seasonally adjusted operating income at a high rate.
The Numbers
Shopify continues to increase revenue, and it is easy to see how operating income increases as well if the operating margin stays the same. Shopify had 2Q24 operating income of $241 million on revenue of $2,045 million. If revenue growth continues at the same pace then at some point they should eventually have quarterly revenue which is double or more than the current level such that it is $4,090 million or more. If margins are the same, then operating income will increase to $482 million at that point. I believe operating income will continue to increase faster than revenue as operating margins keep improving. CEO Jeff Hoffmeister talked about this at Shopify’s 2023 investor day when he noted operating expenses fell from 65% of revenue in 3Q19 down to 45% of revenue in 3Q23. They were even lower at 39% in 2Q24. Here are some of Shopify’s key numbers from recent quarters ($ in millions):
| FCF | FCF % | *SBC | *Op Inc. | *Op Exp. % of Rev. | Gross Profit | Revenue | |
| 4Q22 | $90 | 5% | $ (142) | $ (188) | 57% | $798 | $1,735 |
| 1Q23 | $86 | 6% | $ (135) | $ (193) | 60% | $717 | $1,508 |
| 2Q23 | $97 | 6% | $ (280) | $ (296) | 67% | $835 | $1,694 |
| 3Q23 | $276 | 16% | $ (192) | $122 | 45% | $901 | $1,714 |
| 4Q23 | $446 | 21% | $ (98) | $289 | 36% | $1,062 | $2,144 |
| 1Q24 | $232 | 12% | $ (105) | $86 | 47% | $957 | $1,861 |
| 2Q24 | $333 | 16% | $ (106) | $241 | 39% | $1,045 | $2,045 |
*The operating income and the operating expense as a percentage of revenue exclude impairments.
*The stock-based compensation (“SBC”) numbers above are from the cash flow statement which can be different from SBC reconciliation numbers.
Both operating leverage and economies of scale improve operating margins, but the reasons for the improvement are different. Michael Mauboussin puts things simply in his 2016 operating leverage paper (emphasis added):
The easiest way to think about operating leverage is as the ratio of fixed to variable costs.
Mauboussin goes on to explain how operating leverage and economies of scale differ (emphasis added):
A company enjoys economies of scale when it can perform key activities at a lower cost per unit as its volume increases. These tasks include purchasing, production, marketing, sales, and distribution. Economies of scale lead to greater efficiency as volume increases. This is distinct from operating leverage, where margin improvement is the result of spreading preproduction costs over larger volumes.
If Shopify has an internal AI development that costs them almost nothing but causes one of their marketing employees to bring in twice as many customers while not working extra hours then I think of this as operating leverage. This is different from an economies of scale example such as Shopify paying a supplier x% less per widget once they reach a higher volume of widgets. In an August 2023 podcast, President Harley Finkelstein talks about Shopify moving high amounts of merchandise volume like large retailers which means they have economies of scale (emphasis added):
If you are the second largest retailer in America, you are entitled to massive economies of scale – shipping rates, credit card transaction rates, or rates on borrowing of capital, for example. Because we’re the platform for these millions of stores, we’re able to disseminate those economies of scale to all of these small businesses.
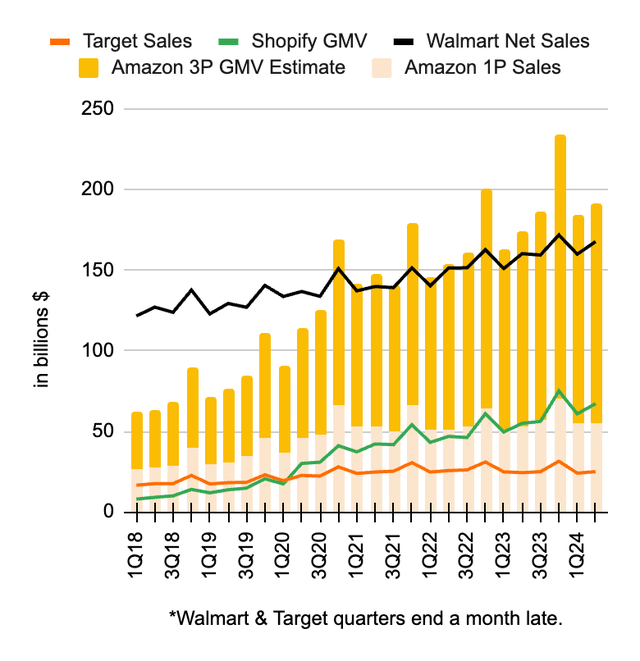
The economies of scale talk above from President Finkelstein about Shopify having equivalent volume to the top retailers in America is not hyperbole. Shopify isn’t a retailer; they’re more of an operating system. Despite this difference from retailers, I like to look at the merchandise volume flowing through various ecosystems:
Merchandise Volume (Author’s spreadsheet)
Costco’s fiscal quarters are confusing so they’re not in the graph above, but they have annual net sales as follows:
$192 billion through August 29, 2021
$223 billion through August 28, 2022
$238 billion through September 3, 2023
Shopify moves much more merchandise through their ecosystem than Target. Recently, Shopify started moving more than Amazon 1P, and they are now in the midst of passing Costco. Economies of scale will continue as Shopify keeps growing.
One of the reasons I like to show SBC in the spreadsheet above is because it lowers operating income but not FCF. The spreadsheet shows SBC is down from the time Shopify hadn’t yet sold off their logistics business. Meanwhile, the other numbers such as revenue are up and this is in line with what CFO Hoffmeister said in the 2Q24 call. Specifically, he said Shopify can continue driving operating leverage through some key things, including a disciplined growth in headcount:
Which we have kept essentially flat for five quarters and where we expect we can keep headcount growth well below revenue growth.
In the 2Q24 call, CFO Hoffmeister also mentioned the internal use of AI as a key factor that drives operating leverage and this has some overlap with headcount. In other words, it is easier to maintain headcount when the internal use of AI and automation makes employees more productive.
Shopify’s get sh- done (“GSD”) system enables some fixed cost considerations to have maximum impact. In the 2Q24 call, CFO Hoffmeister went on to say Shopify can drive operating leverage by:
Continuing to enhance our internally built GSD and Shopify OS systems, which allow us to smartly aim the product development work and size the team for maximum impact and efficiency.
Valuation
A company’s valuation is the amount of cash that can be pulled out of it from now until judgment day. There are many factors I like to consider before making estimates in this regard.
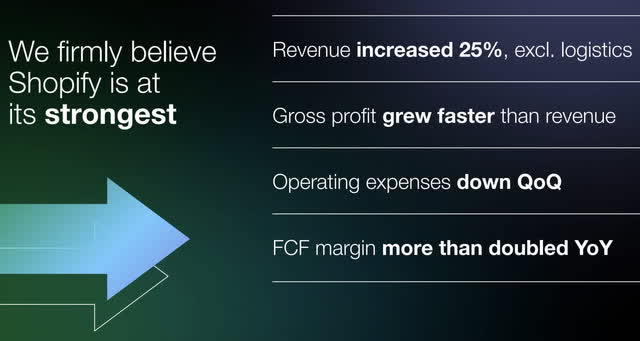
Per the 2Q24 presentation, Shopify has never been stronger:
Shopify is at its strongest (2Q24 presentation)
One of the things that raises Shopify’s valuation is the ease in which they are able to increase revenue through channel partnerships. Shopify continues helping merchants succeed with various channels which brings in more revenue for both merchants and Shopify. An August YouTube (GOOG) (GOOGL) blog post says their partnership with Shopify is strengthening:
Today, we’re excited to share that our partnership with Shopify is expanding. All eligible Shopify Plus and Advanced merchants in the U.S. can now sign up for YouTube Shopping’s affiliate program through the Google & YouTube app on Shopify. What this means for Shopify merchants: You can now join the ranks of hundreds of U.S. brands using the YouTube Shopping affiliate program to enable thousands of eligible creators to showcase your products at scale in their videos.
In the 1Q24 release, Shopify management said they expected 2Q24 “free cash flow margin to be similar to Q1 2024 free cash flow margin.” As such, I was happy to see the FCF margin jump from 12% in 1Q24 up to 16% in 2Q24. This is what management said in the 2Q24 release with respect to what they expect for 3Q24 (emphasis added):
• Revenue to grow at a low-to-mid-twenties percentage rate on a year-over-year basis;
• Gross margin to be higher by approximately 50 basis points compared to Q2 2024;
• GAAP operating expense as a percentage of revenue to be 41% to 42%;
• Stock-based compensation to be $120 million; and
• Free cash flow margin to be similar to Q2 2024. We continue to expect to deliver double-digit free cash flow margin for the rest of the year.
Seeing the “similar” FCF margin expectation again shows why investing can be hard. Management said the FCF margin for 2Q24 would be similar to 1Q24, but it jumped to 16% from 12%. Trailing twelve months (“TTM”) FCF is $1,287 million. I remain optimistic that fiscal 2024 FCF can be $1.5 billion or more. Given the increase in FCF margin from 1Q24 to 2Q24, I am now more sanguine about the valuation range. The top end of an optimistic valuation range is about 60x my 2024 estimate of $1.5 billion in FCF, but this might be stretching things.
The 2Q24 release shows 1,288,900,183 shares and the September 5 share price was $70.11 which gives us a market cap of more than $90 billion. The balance sheet also has $917 million in convertible debt. I think the stock is a hold, seeing as it trades at an extremely high price to FCF level.
Forward-looking investors should listen to the September 10 Fireside Chat with CFO, Jeff Hoffmeister at the Goldman Sachs (GS) Communacopia & Technology Conference.
Disclaimer: Any material in this article should not be relied on as a formal investment recommendation. Never buy a stock without doing your own thorough research.
Read the full article here


