Simon Property Group, Inc. (NYSE:SPG) delivered a solid financial performance in Q3 2023, significantly surpassing its achievements from the previous year. Under the leadership of David Simon, the firm experienced a significant rise in net income attributable to common shareholders. This increase was primarily driven by non-cash, post-tax profits from strategic deals, such as selling part of interest in a joint venture. The company saw a notable expansion in Funds From Operations (FFO), an essential measure in the real estate industry, indicating enhanced operational effectiveness and astute financial management. This piece examines the financial health of Simon Property through Q3 2023 earnings and offers a technical analysis of the company’s stock price to identify future trends and investment prospects. Notably, the stock price presents strength and appears poised to break upwards from key levels.
Simon Property’s Financial Performance
Simon Property showcased impressive financial achievements, mirroring its Chairman, CEO, and President, David Simon’s positive outlook on the company’s robust business expansion. Q3 2023 saw a significant increase in net income for common shareholders, reaching $594.1 million, or $1.82 per diluted share. This performance is a substantial leap from the $539.0 million, or $1.65 per diluted share, seen in 2022. A significant portion of this growth is credited to non-cash after-tax profits of $118.1 million, mainly from the divestiture of some of the stake in the SPARC Group joint venture, decreasing the ownership from 50% to 33%.
Furthermore, Simon Property Group’s FFO exhibited robust growth. The FFO stood at $1.201 billion, or $3.20 per diluted share, an increase from the previous year’s $1.099 billion, or $2.93 per diluted share. This growth not only underscores the company’s operational efficiency but also its strategic financial maneuvers.
For the nine months ending in 2023, the company demonstrated financial resilience. Net income attributable to common stockholders escalated to $1.532 billion, or $4.68 per diluted share, up from $1.462 billion, or $4.46 per diluted share in 2022. This increase included gains from the SPARC transaction and adjustments in the ownership of Authentic Brands Group. The FFO for this period also saw an uptick, reaching $3.304 billion, or $8.82 per diluted share, compared to the previous year’s $3.207 billion, or $8.54 per diluted share.
The company demonstrated operational efficiency with a 4.2% in Q3 2023, an increase in Net Operating Income (NOI) for domestic properties and a 4.3% growth in its overall portfolio NOI compared to 2022. The real estate holdings, especially U.S. malls and premium outlets, exhibited strong performance. This was reflected in enhanced occupancy rates of 95.2% and a 2.9% rise in the base minimum rent per square foot.
Simon Property’s development strategy initiated Jakarta Premium Outlets® in Indonesia, signaling the company’s expansion into new markets. The company’s proactive involvement in the credit markets, marked by successful non-recourse mortgage loans and a strong liquidity position with about $8.8 billion in resources, highlights its effective financial stewardship.
The quarterly common stock dividend increase to $1.90 for Q4 2023, a 5.6% rise from the previous year, along with consistent dividends on its Series J Preferred Stock, underscores the company’s dedication to shareholder returns. Simon Property Group’s 2023 guidance, projecting a net income between $6.67 and $6.77 per diluted share and an FFO in the range of $12.15 to $12.25 per diluted share, reflects a positive and ambitious outlook for the company, underscoring its stable foundation and strategic initiatives for continued growth and profitability.
Overall, Simon Property Group’s financial results for Q3 2023 highlight a trajectory of significant growth and operational strength. The company’s strategic initiatives, including its successful diversification through the SPARC Group, the launch of Jakarta Premium Outlets®, and practical financial management, have solidified its position in the real estate market. With robust increases in net income, FFO, dividends, and positive guidance for the year, Simon Property demonstrates its resilience in a dynamic economic environment. It reaffirms its commitment to delivering value to its shareholders, positioning itself for sustained success in the future.
Deciphering the Dynamics of Bullish Market Trends
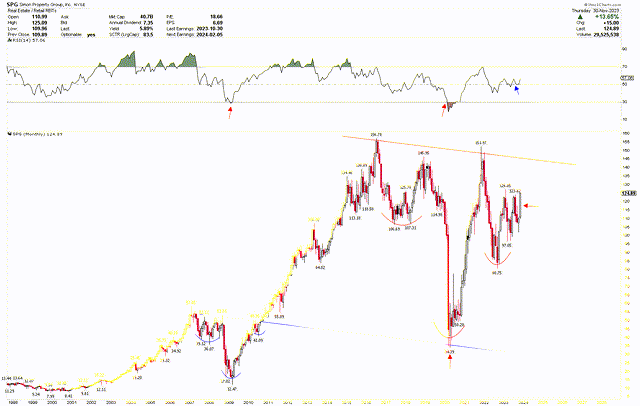
The monthly chart below indicates a robustly bullish long-term perspective for Simon Property. The company reached its lowest point in 2009, after the Great Recession, with a share price of $12.47. It subsequently experienced a significant rally, culminating in all-time highs in 2016. This impressive upward trajectory was initiated following the breakout from an inverted head and shoulders pattern, where the lowest point (the head) was at $12.47, and the two peaks (the shoulders) were at $36.07 and $41.09, respectively.
This significant price increase from 2009 was due to a combination of factors. Firstly, the post-2009 period was marked by a gradual recovery from the global financial crisis, which boosted investor confidence and spending power, benefiting the retail sector. With its diversified portfolio of high-quality retail properties, including malls, premium outlets, and shopping centers, Simon Property was well-positioned to capitalize on this upswing. Additionally, the company’s strategic acquisitions and development projects expanded its footprint and diversified its revenue streams. Simon Property also demonstrated strong operational efficiency and effective management, optimizing occupancy rates and rental income. Moreover, the rise of e-commerce, rather than hurting mall operators as predicted, often complemented physical retail spaces, as many online retailers started opening physical stores. These factors enhanced investor sentiment towards Simon Property, driving its stock price to hit all-time highs at $156.78.
SPG Monthly Chart (stockcharts.com)
The robust rally took a sustained break after reaching record highs, leading to decreased prices. This decline retraced back to the original breakout level of the inverted head and shoulders pattern, which was the point where the initial surge originated. At this juncture, marked by the blue neckline, the price reached a low of $34.39 before reversing its trajectory and ascending again in 2020.
The stock price of Simon Property Group witnessed an upward trajectory after reaching a low in 2020, primarily due to the gradual easing of COVID-19 restrictions and the return to more normal consumer behaviors. As one of the world’s largest retail real estate companies, Simon Property’s portfolio, which includes numerous shopping malls and premium outlets, was significantly impacted by the pandemic-induced lockdowns and social distancing measures. However, as vaccines became widely available and consumer confidence started to rebuild, foot traffic in physical retail locations rebounded. This resurgence was critical for Simon Property, as it boosted rental revenues and reaffirmed the importance of physical retail spaces. Additionally, Simon Property’s strategic decisions during the pandemic, including acquisitions and partnerships, further strengthened its market position. Investors recognized the company’s resilience and the potential for a strong recovery in the retail sector, positively reassessing its stock value.
This robust price rebound, accompanied by a consolidation phase, has led to a pronounced inverted head and shoulders pattern. This pattern’s lowest point (head) is identified at the 2020 low of $34.39, with the peaks (shoulders) at $106.69 and $80.79. Notably, the RSI was extremely oversold during the 2020 lows, echoing a similar scenario from the 2009 lows. Furthermore, the RSI has maintained its level above the midpoint, indicating underlying price strength and the potential for further increases. The October 2023 monthly candlestick was a bullish hammer, followed by a robust candle in November, suggesting that prices will likely continue their upward trajectory in the forthcoming months.
Key Action for Investors
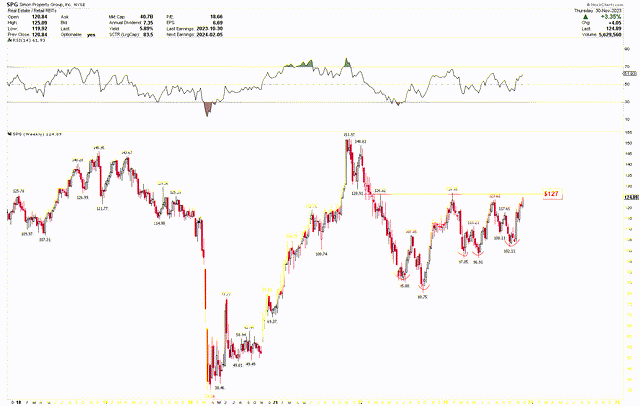
The weekly chart further supports the bullish view, displaying a notable double-bottom pattern. This pattern was first observed in 2022, with lows at $85.88 and $80.75, leading to a strong bullish reversal. A similar double-bottom pattern occurred in 2023 at $97.05 and $96.91. Following a price drop, a rapid and robust recovery is noticeable in each instance, characterized by swift reversal candlesticks. The neckline of this bullish formation is around $127, and a weekly closure above this mark could pave the way for additional upward movement. Therefore, this level is marked as a key level.
SPG Weekly Chart (stockcharts.com)
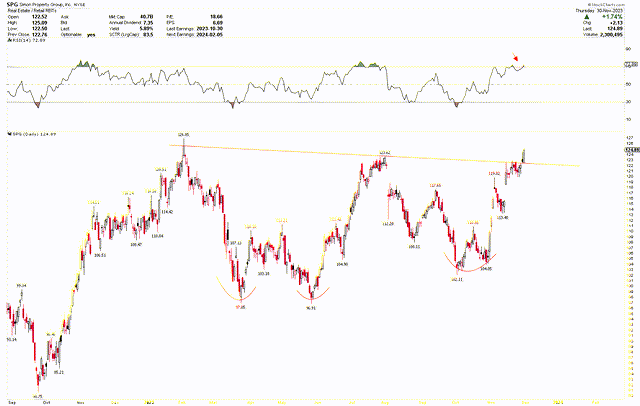
This bullish trend is also mirrored in the daily chart, where another double bottom at $102.11 and $104.05 preceded a significant price rally, now approaching a key trendline. While the RSI indicates overbought conditions in the short term, a minor correction will likely be overturned by a return to upward momentum. Given these bullish indicators, investors might consider purchasing Simon Property shares at the current levels, with a strategy to augment their holdings should the stock experience further dips.
SPG Daily Chart (stockcharts.com)
Market Risk
The real estate market, mainly retail, is susceptible to the broader economic climate. Factors such as inflation, interest rate hikes, and economic downturns can directly impact consumer spending and the health of the retail industry. For Simon Property Group, the portfolio heavily relies on retail tenants; a downturn in consumer spending can lead to decreased foot traffic and potentially higher property vacancy rates. Moreover, the company’s international expansion, such as the Jakarta Premium Outlets® in Indonesia, exposes it to geopolitical risks and currency fluctuations, which could affect its revenue and profit margins.
The retail real estate sector is undergoing significant transformation, primarily driven by the rise of e-commerce. While Simon Property has shown adaptability in this changing landscape, the ongoing shift in consumer shopping habits towards online platforms poses a long-term risk. The company must continually innovate and possibly restructure its retail spaces to stay relevant and attractive to tenants and consumers. The retail sector is highly competitive, with numerous players vying for prime locations and tenants. Simon Property’s ability to maintain market leadership amidst this competition is crucial for its continued success. Technically, if the price falls below $80, it could reverse the positive outlook and trigger additional downward momentum.
Bottom Line
In conclusion, Simon Property demonstrated a remarkable financial performance in Q3 2023 under the adept leadership of David Simon. The significant rise in net income for common shareholders and the expansion in FFO are testaments to the company’s operational efficiency and savvy financial strategies. These achievements are further highlighted by the growth in dividends and positive guidance for the year ahead.
The technical analysis of SPG’s stock price reflects a bullish long-term outlook. The historical context of its price movements, particularly the recovery post-2009 and the resilience shown during and after the COVID-19 pandemic, underlines the company’s strength in adapting to challenging economic scenarios. The current patterns observed in the monthly, weekly, and daily charts, including the inverted head and shoulders and double-bottom patterns, indicate a strong potential for continued upward momentum in the stock price. Investors may consider buying shares at the current price, anticipating a breakout above the $127 mark, and plan to increase holdings should the price decline.
Read the full article here


