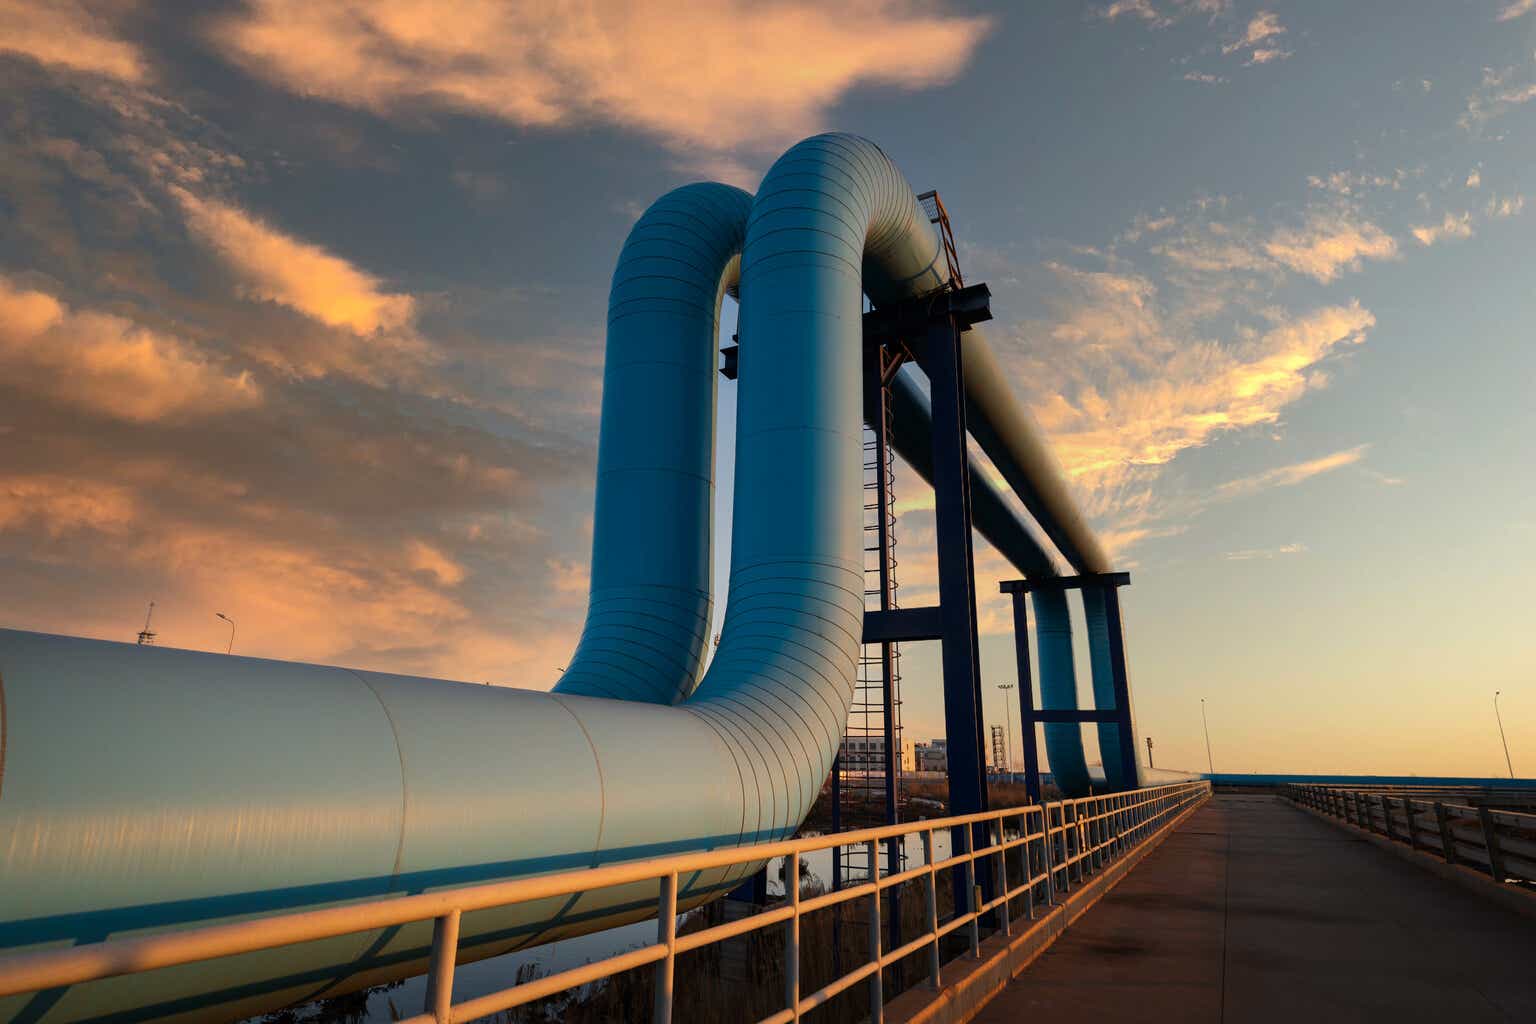
Oil pipeline in the sunset
The last time I covered Enbridge (NYSE:ENB) (TSX:ENB:CA) stock, I rated it a hold. The reason for this rating can be found in the article I wrote on it, but basically, I had two concerns about the stock:
-
The payout ratio at the time was very high.
-
The balance sheet had a lot of leverage in a time of rising interest rates.
Point #2 basically still stands. Enbridge is still very indebted, and some of the debt has floating rates. However, the debt situation has actually improved somewhat in recent quarters: in Q3, the net debt level declined by nearly $4 billion from the prior quarter. Also, the current ratio – 0.66 – is slightly better than the level it was at when I last covered the stock (0.6).
So ENB’s balance sheet strength has improved.
Something else has improved too:
The cash flow payout ratio. Enbridge still pays out more in dividends than it earns in GAAP profit, but it recently experienced an increase in free cash flow that pushed the “FCF payout ratio” below 100%. The last time I wrote about ENB, the earnings and FCF payout ratios were both well above 100%.
The data I’ve used up to this point has been trailing data: fundamental metrics from the company’s financial statements, and historical stock prices. It’s important to also estimate how well ENB will do in the year ahead. You don’t get paid last year’s dividend if you’re just buying the stock today, it’s the next year’s dividend that counts. So, we need to know what dividend Enbridge plans to pay next year, and how capable it is of paying it.
The Debt Situation
As mentioned in the introduction, Enbridge’s net debt declined last quarter. That wasn’t enough to keep interest expenses from rising: they increased by 6.7% in the same quarter. However, this small increase in interest expense is a lot better than it looks.
Benchmark interest rates in Canada went from 3.25% to 5% between Q3 2022 and Q3 2023. That 175 basis point change translates to a 53.8% increase in the interest expense of the interest payer. That might sound confusing-isn’t 175 basis points 1.75%?–but remember that ‘basis points’ measure differences in interest rates against a principal amount. If you’re paying $3.25 a year on a variable rate loan, and you get hiked to $5, then the increase in your interest expense is $1.75/$3.25, or 54%.
Viewed in this light, Enbridge’s mere 6.7% year over year increase in interest expenses is pretty good. Had it not been for the debt reduction, then Enbridge’s interest expense might have shot up by high double digit percentage points. An extension of this, of course, is that if Enbridge pays off more debt and/or the Bank of Canada starts cutting rates, then Enbridge’s profit will increase, holding everything else constant. Alternatively, if the company borrows money and earns more from an acquired asset than it takes on in new interest expense, its profit will also increase.
Will Enbridge actually pay off more debt? Alternatively, will it do a leveraged deal that will be profitable after accounting for a future increase in debt? Will the Bank of Canada start cutting rates? These are important questions to answer before attempting to gauge Enbridge’s future earnings. In the paragraphs below I’ll attempt to answer a few of them.
ENB’s Future Earnings: The Cost Side
Bluntly, it does not look like Enbridge’s debt level will continue to decline. Instead, it’s poised to rise by $14 billion. However, the assets this new debt is paying for will be accretive to earnings.
Here are the two big costs Enbridge has on the horizon.
-
A $14 billion deal to purchase some U.S. natural gas assets.
-
A court ordered series of capital expenditures related to a 66-kilometre re-route of a section of pipeline in Wisconsin. This will incur a $5 million fine, at minimum. Enbridge is in the process of appealing this decision, so it may ultimately not increase costs at all.
The U.S. natural gas deal costs $14 billion. At least $4.6 billion of that is debt assumed from the acquired assets. Enbridge has obtained $9.4 billion from Morgan Stanley (MS) and Royal Bank of Canada (RY) (RY:CA) to cover the cash outlay. The company is also issuing equity to raise cash, but it’s prudent to assume a full $14 billion is borrowed. $14 billion financed at 5% interest is $700 million in new interest. There are no indications that any existing debt will be paid off. So, debt should increase from $57 billion to $71 billion, and interest expenses should increase from $2.6 billion to $3.3 billion.
Is this new debt going to drive positive returns for shareholders? Enbridge says that it’s buying the new assets at a 16.5 P/E ratio. That implies that the acquired assets are generating $848 million in earnings. This is after interest expense, so the interest on the $4.6 billion in assumed debt is already factored in. What still has to be subtracted is the interest generated by the newly borrowed $9.6 billion. At 5%, that’s $480 million. What we’re left with is $368 million in earnings after interest. Enbridge doesn’t say in its deal press release whether the new assets’ earnings are before or after tax, so we’ll leave it there.
There’s some good news and some bad news coming from this.
The bad news is that Enbridge’s debt is set to increase once more. The good news is that the new assets appear to generate more earnings than the debt generates in interest expenses. If Enbridge is being realistic in how much money it thinks it can earn from the new assets, that’s $368 million in annual earnings power generated. If you assume that earnings don’t change at all compared to the trailing 12-month level apart from the earnings the deal brings in, then earnings jump from $3.4 billion to $3.76 billion. This takes GAAP EPS from $1.1 to $1.85. As a result, the GAAP payout ratio comes down from 220% to 140%. That is still above what’s considered sustainable, but:
-
It is an improvement over trailing 12-month period numbers.
-
We already have the free cash flow payout ratio comfortably below 100%. As long as the deal doesn’t actively reduce FCF then overall dividend coverage improves.
The Revenue Side Of The Equation
There are other aspects of Enbridge’s profit picture that are worth discussing here. Chiefly the revenue side of the equation. ENB’s third quarter revenue was the lowest amount of revenue
the company reported in the 11 quarters Seeking Alpha has on file. This was not due to lower pipeline fees: those increased slightly in the period. Instead, it was due to a weakness in commodity sales. Enbridge is involved in buying and selling natural gas, petroleum, and other commodities for profit. This part of Enbridge’s business isn’t talked about as much as the more well-known pipeline business, but it’s a large contributor to revenue. Unlike the stable pipeline business, this business’ revenue fluctuates widely with commodity prices. It’s quite possible that the decline in commodity sales was due to low natural gas prices: that commodity saw its price decline 43% year-over-year in September. That may have contributed to the company’s revenue decline; if so, the revenue decline should reverse, as natural gas prices rose in November. Should this trend persist then Q4’s commodity sales will be higher than Q3’s, although we don’t have enough detail here to model a precise figure.
Valuation
To summarize what we’ve seen so far: Enbridge’s debt level has been coming down. Its earnings declined in the most recent quarter, but free cash flow increased. The free cash flow payout is already below 100%. The upcoming deal should improve the GAAP earnings-based payout ratio, though not take it below 100%. Broadly, Enbridge’s dividend sustainability is improving. If the Bank of Canada starts cutting rates then that will be an extra boon to the company, as it will reduce the interest on its variable rate debt.
So, what’s Enbridge’s stock price doing in response to all this?
Curiously enough, it’s down about 12.30% year-to-date. Even though free cash flow is rising, Enbridge stock is declining. As a result of the stock price decline, ENB trades at:
-
16.5 times adjusted earnings.
-
31 times GAAP earnings.
-
2.2 times sales.
-
1.7 times book value.
-
7 times operating cash flow.
-
10.8 times free cash flow.
The cash flow multiples here are sensible. The GAAP earnings-based P/E ratio is high, but if GAAP earnings rise to $1.85 as I predict, that ratio will come down to 16.5 (assuming the stock price doesn’t change).
To wrap it all up: Enbridge has an extraordinarily high yield that is well covered by FCF, and a modest valuation. The price/cash flow multiples are quite low, suggesting that investors are paying relatively little for ENB stock compared to the cash flows the company earns. Those cash flows ultimately drive dividend-paying ability, so Enbridge looks like a pretty good value here overall.
Of course, there is a major risk here: the possibility that ENB’s estimate of its newly acquired assets’ earning power is incorrect. If that’s the case then the earnings increase I anticipate may never materialize. Still, the company is cranking out a lot of free cash flow – more than enough to keep the dividend coming. I expect those buying the stock today to earn the 7.6% yield now being advertised. After this year’s 12.3% decline in the stock price, they might even get a little capital gain as well.
Read the full article here
